

Election Context

Happy election day everyone. Go vote.
Now that you’ve voted, let’s talk about what to expect.
I’m honestly not sure what to think about the polling data—it’s been really wild. Polling for this election is more complicated than it has been for any election I have ever seen. Here is how polling normally works, and I’m gonna have to use the word normal a lot. Polling organizations figure out who normally votes, and asks a sample of them (samples really don’t need to be huge, a few thousand is a pretty big sample) who they are going to vote for. Then they use statistics to project those normal voter’s preferences onto all the other normal voters who are normally like them, and estimate what the normal outcome would be for normal elections.
In case you haven’t noticed, nothing is normal this year.
Election experts are saying voter turnout is going to be really high this year. On top of that, here are a few things that factor into this election that have never been a part of any election at any time in history:
The new Congressional map drawn after the 2020 census.
The Supreme Court overturning Roe V. Wade, and eliminating a constitutional right.
Candidates who do not believe the current president won the last election.
A party that has not put out a single official policy they plan to push if they win.
Russia invading Ukraine and casing global market kinks.
A political party that isn’t shy about ending support for our ally (Ukraine) because they not-so-secretly support our enemy (Russia).
That is just off the top of my head, I’m sure I’m forgetting a few other firsts too.
All of this stuff has a huge impact on polling. It’s pretty easy for pollsters to ask people about this stuff, and figure out how they feel. The problem comes in using statistics to project election results when all this very much not normal stuff is happening.
All of these things can make different types of people more likely to vote for different reasons. Pollsters can’t talk to all voters in a year, so trying to figure out which people are what percent more likely to vote is a best guess. There is no “last time this happened” to fine tune that guess.
Normally the statistics go kind of like this: “Of these 10 white, college educated, suburban women with more than one child, only 4 voted last time, but 7 say they will vote this time. Last time, 2 voted for a Republican and 2 voted for a Democrat. This time, 5 say they will vote for a Democrat. All 4 who voted last time will vote for a Democrat, which means 2/3 of the new voters are voting Republican.”
Now, is it “safe” for a pollster to assume that most white, college educated, suburban women who voted last time will vote for a Democrat this time, and that half of these women who didn’t vote last time will vote this time, and that 2/3 of these new voters will vote Republican?

And that’s why polling this year is so hard.
Pollsters are really smart, and these questions become easier with more and more samples—but, but, but. All of the things that have never happened before mean that things pollsters have done in the past to adjust polling predictions for high turnout might not be the “right” adjustments to make this time.
I hope you’re enjoying this letter so far. If you haven’t already, sign up for free to make sure you catch every edition of The Constituent. All content is available with the free subscription.
Let me just give you a few examples of what I mean about all this. The last governor’s elections in New York and Oregon saw Democrats winning 60-36 and 50-44. If we believe pollsters, Republicans might win both of these races today. In Oregon the complicating factor is an independent candidate with loads of money, and in New York we have the standard crime and economy narratives.
In the last Oregon Governor’s race about 6.3% of voters voted for a candidate that wasn’t in one of the two major parties. If every single one of those voters votes for the Republican, the Democrat would still be about 2,000 votes ahead. Because there might be a lot of new voters this election, the math isn’t straightforward, but the independent basically has to have 2 Democrats vote for her for 1 Republican who votes for her, and get double the number of people voting for a non major party candidate (assuming everyone who doesn’t vote Democrat or Republican votes for this one independent) in order to pull enough voters away from Democrats that the Republican can win. That seems like… a pretty big stretch?
In New York we are supposed to believe the race is within a couple of points? Last time the Democrat won by over 1.4 million votes. There simply aren’t enough voters in New York to expect to make up that margin with new voters—almost every single new voter would have to vot Republican. To put it in perspective, 1 of every 4 voters who voted for a Democrat last time would have to switch to the Republican for the Republican to win. The Republican is a pretty far right extremist, so this isn’t likely. I get that 2018 was a great year for Democrats in general, but even in the 2014 race—which wasn’t a Democratic wave year—the number would still have to have been about 1 in 4.
Even if the Republican gets 3.2 million votes (which is what Trump got) the total for Democrats from 2018 would still be 400,000 votes ahead. So, even if the high turnout favors Republicans heavily—2020 numbers for Republicans and 2018 numbers for Democrats—the Republican is still miles behind. The Republican winning lane here is basically this: 2020 turnout for us, but not for them, and have 11% of all 2018 Democrat voters switch parties.
Are these two outcomes impossible? Of course not. Late tonight we might find out that both of these upsets happened. Maybe this will be one of the biggest landslide elections in history.
But, maybe it’s not.
Maybe pollsters are trying to figure out how to incorporate all the first time things into polls, and trying to correct for short-counting Republican votes in 2020 at the same time, and they aren’t quite hitting the mark. I honestly have no idea!
Republicans seem likely to win tonight, but with all the firsts the pollsters have to deal with, I wouldn’t call that a sure thing.
Likely, but not certain.
Having fun? Learning something new? If so, do me a favor and let your friends know about The Constituent.
In this state of uncertainty, here is the best way for you to judge election results tonight.
The first midterm election a president faces is usually pretty bad for the President’s party. The one exception to this is 2002—an election that was just a year after 9/11.
So, the best way to frame who “wins” tonight is to judge what happens against what normally happens in this situation.
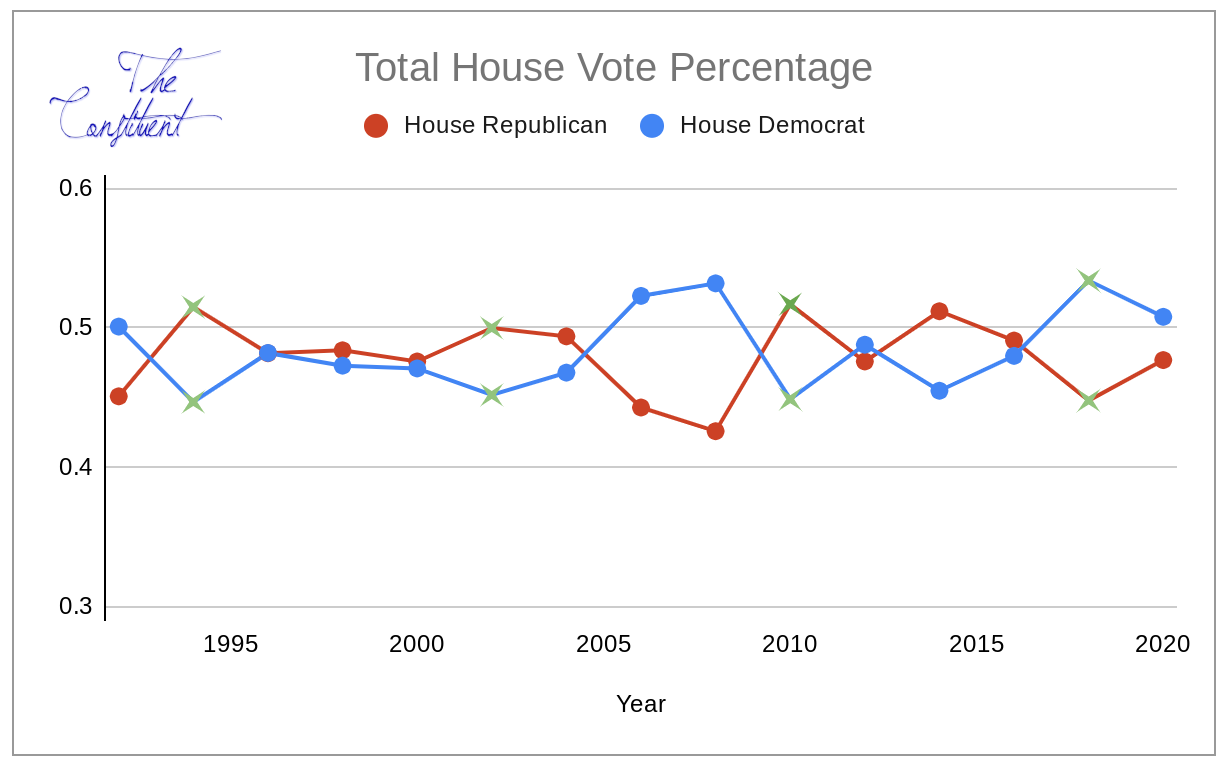
Here are graphs for the percentage of votes for each party for House of Representatives (above) and the number of seats in the House (below).
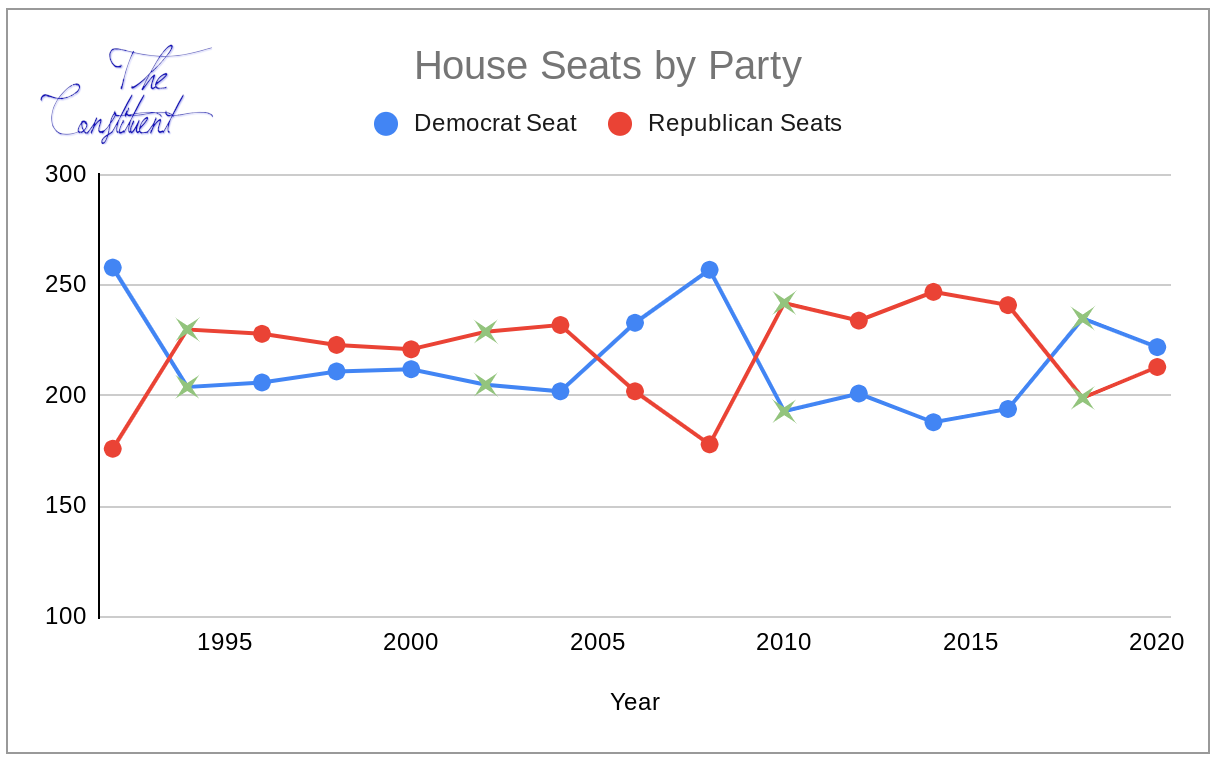
The green X’s on these graphs are midterm elections in the first term of a president in the last 30 years. This is the ‘normal’ to compare to. What ‘normal’ would be here is if Democrats get about 44% of the total House vote, and lose somewhere in the 22-28 seat range. If, at the end of the night, Democrats win 48% of the vote, and lose 15 House seats that would be a pretty dang good night for Democrats. If Republicans win 53% of the vote and gain 35 House seats, that would be a pretty dang good night for Republicans.
The thing to understand here is not that one party winning or one party losing is the bottom line. Given the circumstances the expectation is that Democrats lose. But, losing by less than normal would suggest that the Democrats are actually in a pretty good place/Republicans are in a pretty bad place.
The Senate is not as straightforward. Every House member has to run for reelection every two years, but only 1/3 of the Senate is up for reelection because they serve 6 year terms. Because of this, even the green X’s on the graph aren’t exactly the same. The last time this same third of the senate seats were up for reelection, and it was a first term midterm was 2010. Maybe that was an extreme outlier of a year (maybe this year is too, who knows?). In 2010 Republican won 6 Senate seats, but that left them with only 49 total seats—despite record low vote shares for Democrats in this 30 year span.
The best map in the 6 year cycle for Republicans was in 2020, and they only managed a 50-50 split. So, what is winning for Republicans this year? Well, if 2010 suggests anything, even 49 seats would be a win. But this would mean losing in GA, PA, OH, or WI—states that should have been fairly easy wins. So, maybe 49 seats isn’t a win—considering last time this set of states was running in the Senate (2016) Republicans won 52 seats.
For my money, that is where I would put the mark. The last time this set of states was on the ballot Republicans won 52 seats with only 42% of the total vote. Given that this year is expected to be a good year for Republicans (a Democratic President’s first midterm), if they don’t win 52 seats this it will be a bad night, even if win the Senate.

Keep all this stuff in mind tonight while you are watching/ignoring election returns. There will be a lot of media hype about one party or another doing historic things—but now that you know what historic would actually entail, you won’t be fooled.
FINAL NOTE:
I have, in the past, hosted a social media Q&A during the election night to answer questions about results. Comment on this, or reply to this email and let me know if you’d like to do something like that here on Substack tonight.
Thanks for reading The Constituent. If you’d like to support the newsletter, here are a few options.
-Thanks,